Dietary Guidelines for Americans (DGA) [1] have shaped US nutrition policy since 1977.These national dietary guidelines are updated typically once every 5 years by the U.S. Department of Health and Human Services (HHS) and the U.S. Department of Agriculture (USDA)–to reflect evolving scientific evidence on nutrition, health and disease prevention – to create a shared definition of what constitutes a “healthy diet”. The influence of this goes beyond individual food choices, informing public nutrition programmes, agricultural production, marketing practices, clinical advice and many other aspects of the food systems.
The 2026 DGA: Lacking a Sustainability Lens
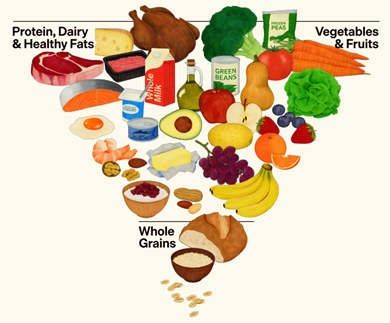
Figure: The U.S. DGA food pyramid, whose inverted structure appears to place greater visual emphasis on protein foods, fats, vegetables, and fruits as compared with grains in the traditional pyramid.
On 7 January 2026, the 10th edition [2] of the Dietary Guidelines for Americans was released. These guidelines emphasise “real-foods”, encouraging consumption of “whole, nutrient-dense foods—protein, dairy, vegetables, fruits, healthy fats, and whole grains … paired with a dramatic reduction in highly processed foods”. While the move away from ultra-processed foods broadly aligns with nutrition science, there remains criticism [3] over whether the suggested diet – particularly its emphasis on animal protein, dairy, and red meat – is in fact necessary or optimal for health.
These discussions are legitimate. However, another, more fundamental concern is that sustainability was not explicitly addressed in the guidelines. Environmental and social outcomes were either omitted or not considered as part of the assessment of these dietary guidelines.
Ruminant meat and dairy, in particular, are linked to high greenhouse gas emissions, land use requirements, fertiliser pollution, and water use.
Here, we ask a simple but important question: what do these dietary guidelines mean for sustainability if adopted – and how do alternative diets compare?
Simulating Diets with the FeliX ISE
FeliX Integrated Simulation Environment (ISE) allows users to examine for themselves how dietary patterns (also other food-related behaviours) are linked to sustainability outcomes. Understanding these system-wide interactions is often challenging due to the complexity of food systems. The FeliX ISE aims to make this complexity more approachable by packaging scientific evidence in an accessible way, enabling a broader audience to engage, assess, and learn from it.
The FeliX ISE allows users to simulate a hypothetical world in which everyone shifts to a given diet, helping to illustrate how individual food choices might scale up to global impacts. The tool simulates impacts across six interconnected sustainability systems: land use, climate, fertiliser use, biodiversity, water use, and nutrition.
Below, we use a few simple experiments to show how this works.
Are the new US Dietary Guidelines Sustainable?
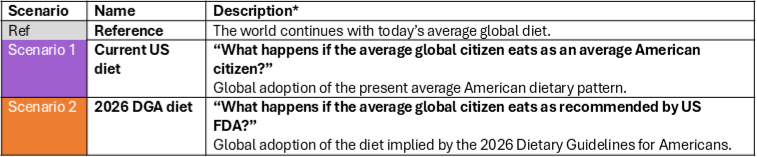
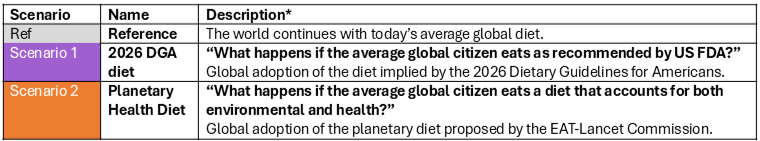
In our first experiment, we compare three stylised scenarios to explore whether the new dietary guidelines are nudging the US’ dietary patterns in a more sustainable direction.
*Details of the underlying calculations are provided in the supplementary information. The experiment can also be explored interactively with this link.
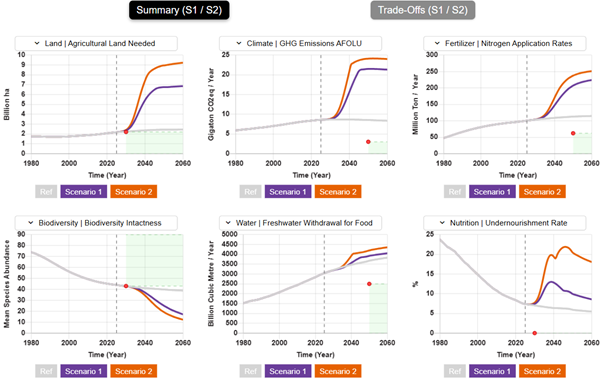
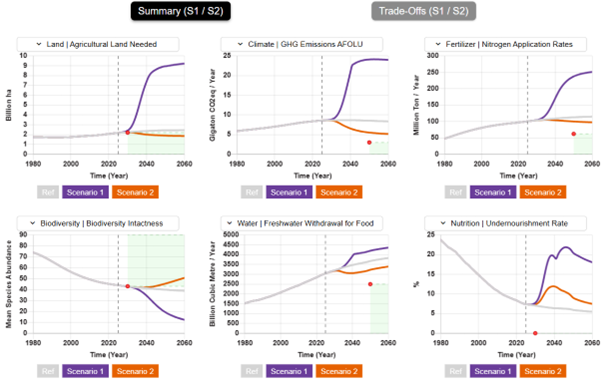
Figure: Comparison of three dietary scenarios using the FeliX ISE: today’s global diet (Reference), current US diet (Scenario 1), 2026 DGA diet (Scenario 2). Red dots and green boxes show sustainability reference ranges from multiple sources.
At first glance, the results are striking. The scenario representing the current USdiet already offers a clear reality check. Compared with reference benchmarks, it already moves in the opposite direction from sustainability targets (shown by the red markers). It is not environmentally sustainable and is closely linked to many of today’s food-system pressures, including high greenhouse gas emissions, extensive land use, and biodiversity loss.
More concerning is that the new dietary guidelines perform even worse. Across every sustainability domain assessed, they lead to poorer outcomes than the existing US diet, in some cases by a substantial margin — for example, through increased pressure on agricultural land (top left on the figure).
These outcomes are largely driven by a higher share of animal-sourced foods. Based on our estimates, the current US diet already contains roughly twice the global average share of calories from animal sources, while the dietary guidelines could increase this to nearly three times the global average. Widespread adoption of these diets would affect the environment in several interconnected ways:
Land use. Higher demand for animal-sourced food increases the need for feed crops and grazing land. Expanding agricultural land use and intensifying pressure on forests and other natural ecosystems are among the leading drivers of global habitat loss.
Fertiliser use. Expanded feed production also leads to increasing fertiliser use. Much of these nutrients end up in waterways or the atmosphere, contributing to eutrophication and ecosystem degradation.
Water use. Producing animal-based foods requires large amounts of freshwater, primarily to grow feed crops. This puts pressure on rivers, lakes, and aquifers, especially in regions already facing water scarcity.
Biodiversity. Agricultural land conversion as well as fertiliser pollution both harm biodiversity. Habitats can become more fragmented, and the species compositions in both land and water systems can change, often in irreversible ways.
Climate. Animal-sourced foods, especially ruminant meat and dairy, contribute disproportionately to climate change through methane emissions, nitrous oxide from fertiliser use, and carbon dioxide released from land use changes.
With the FeliX ISE, you can dive deeper into the targets and explore these pathways on your own.
Alternative Diets to Negotiate Health and Sustainability
In our second experiment, we used a similar setup to the first one, except swapping the second scenario with an alternative, more “sustainability-optimistic” diet.
*Details of the underlying calculations are provided in the supplementary information. The experiment can also be explored interactively with this link.
Figure: Comparison of three dietary scenarios using the FeliX ISE: today’s global diet (Reference), current US diet (Scenario 1), Planetary Health Diet (Scenario 2). Red dots and green boxes show sustainability reference ranges from multiple sources.
It might seem a bit pessimistic, given the results of the US Dietary Guidelines we have just seen. This is not a lost cause. Nutrition and environmental sustainability do not have to be in conflict; a thoughtful diet can be healthier and also reduce environmental pressures.
Shifting toward pulses, grains, and plant-based proteins is one example of a positive change. The orange scenario in the figure, which represents the Planetary Health Diet [5] proposed by the EAT-Lancet Commission, illustrates how such a diet can deliver a wide range of sustainability gains across multiple dimensions.
The real challenge isn’t whether diets can be both healthy and sustainable, but whether we are willing to consider both objectives at the same time.
Individuals: Small Changes Go a Long Way
Small changes can have a meaningful impact. There is no reason to feel discouraged by the thought that your efforts are too small or that you cannot fully commit. The focus should be on moving in a positive direction.
While some people may choose to make major lifestyle changes like going vegan, even small, positive adjustments can have an impact. Approaches like the Planetary Health Diet or flexitarian diets do not require giving up meat entirely—they encourage eating less, choosing more sustainable options, and making gradual improvements.
Even if you follow the general recommendations of the Dietary Guidelines for Americans, you can make subtle modifications. For example, you could still aim for a higher protein intake while shifting toward plant-based sources like legumes and soy, or other alternative protein products, instead of relying mainly on meat and dairy.
Community: Power of Collective Choices
In the scenario experiments, we imagined a world in which everyone adopted a single diet. While this is unlikely to happen in reality, it helps illustrate the potential scale of impact that we can collectively have. There is reason to be optimistic about the possibilities of large-scale positive change.
Top-down norm-setting approaches (such as dietary guidelines) may not fully account for sustainability goals; however, individuals and communities can exercise their agency to shape a more sustainable “mainstream” from the bottom up. By making informed choices and engaging with those around us, we can contribute to gradual social change, positively influencing the habits of friends, families, and broader communities.
Figure: FeliX Logo
This experiment also highlights the value of tools such as the FeliX Integrated Simulation Environment (ISE). By allowing users to customise diets and immediately explore their broader implications, such platforms democratize access to scientific knowledge about food systems. The tool does not prescribe a single “correct” diet; instead, they empower citizens to ask informed questions and participate in shaping the collective future of food.
This work is funded by CHOICE, a Horizon EU project.
Supplementary Information
FeliX’s Food Groups:
Pasture Meat, e.g. Beef, Sheep, Goats
Crop Meat, e.g. Chicken, Pork, Fish
Dairy, e.g. Milk, Cheese, Butter, Cream
Eggs, e.g. Chicken, Duck, Quail Eggs
Pulses, e.g. Lentils, Chickpeas, Black Beans, Kidney Beans, Peas
Grains, e.g. Wheat, Rice, Corn, Oats, Barley, Quinoa
Vegetables and Fruits also include Roots and Tubers, e.g. Carrots and Potatoes.
Other Crops e.g. Oil Crops, Sugar, Nuts, Spices
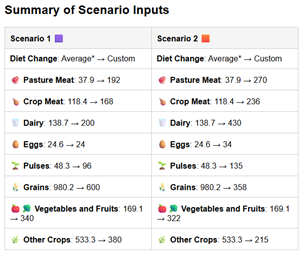
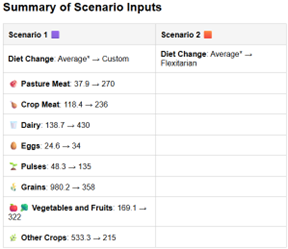
Summary Inputs for Experiment 1 and 2:
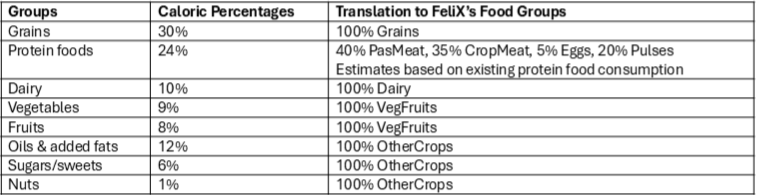
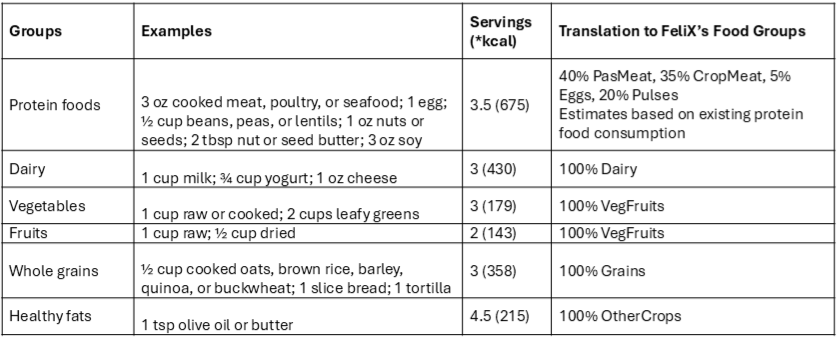
Experiment 1: Scenario 1 (US Current Diet); Scenario 2 (2026 US DGA)
Experiment 2: Scenario 1 (2026 US DGA); Scenario 2 (EAT-Lancet Planetary Health Diet)
Calculation of Current US Diet Estimates (2018) [7]